Unraveling Bird Sounds with Spectrograms
Sana Chawla and Jay Patel
November 12th, 2023
Imagine being able to 'see' the intricate melodies of birdsong. Spectrograms make this possible, providing a means of visually representing sound, beyond what our ears can perceive. For the Cornell Lab of Ornithology's research, being able to visualize and analyze the audio of the birds is vital in their research. Therefore, the Software team is working on coding a spectrogram in C that can be used to analyze the audio data of the thrushes.
What is a Spectrogram?
A spectrogram is a powerful tool in the audio analysis arsenal. It is a way of visualizing the signal strength, or "loudness" of a signal, (in our case audio signals) over time at various frequencies. This then allows a researcher to discern patterns, pitches, and intensities. Spectrograms are widely used for audio analysis, to detect seismic activity, in RADAR/SONAR etc.
How to read a Spectrogram?
A spectrogram is like a graph, where the X-axis represents time and the Y-axis represents the frequency range of the audio. We can think of color as a sort of "third axis" that represents the amplitude, (or how loud), a particular frequency is at a particular time stamp.
An example of a spectrogram is shown below: it represents the audio signals from a violin. We can see multiple lines stacked over each other with different brightness. This is because the notes from a violin contain multiple frequencies, and the brightest ones are the most dominant. These are called harmonics or overtones.

The Spectrogram Deep Dive
Now that we've introduced what a spectrogram is, let's delve into the specifics of how we create one and what the different aspects of the visual representation mean. Our objective is to transform the delicate chirps and sounds of birds into a visual narrative that unfolds over time.
Creating a Spectrogram: A Step-by-Step Process
- Capturing the Sounds: The first step is to capture the audio data. In our case, this means recording the bird sounds we want to analyze. The recording is then converted into digital form, which can be read by our software - think of this as translating the sounds (or birdsongs) into a language computers can understand.
- Harmonizing Nature's Notes - Preprocessing: Before analyzing, we need to ensure our audio is clean and consistent. This means normalizing the volume so the loudness is uniform throughout the recording. Then we apply a windowing function - Hamming or Hanning - to mitigate distortions and ensure each segment of our audio fades in and out smoothly. This preprocessing is like tuning our instruments before a concert to ensure the best performance.
- Decomposing the Sounds: With our audio data prepped, we perform a Fast Fourier Transform (FFT). This mathematical algorithm breaks down the audio into its constituent frequencies - the building blocks of sound. It's akin to a chef deconstructing a recipe to its individual ingredients to understand the contributions of each one.
- Assembling the Visuals: - The FFT output is a complex mixture of frequencies and amplitudes. We calculate the magnitude for each frequency bin to understand the 'volume' of each frequency at any given time. These magnitudes are then mapped onto a color scale - brighter colors denote louder sounds. This creates a vivid image, not unlike a thermal camera showing varying degrees of heat.

Interpreting the Artwork
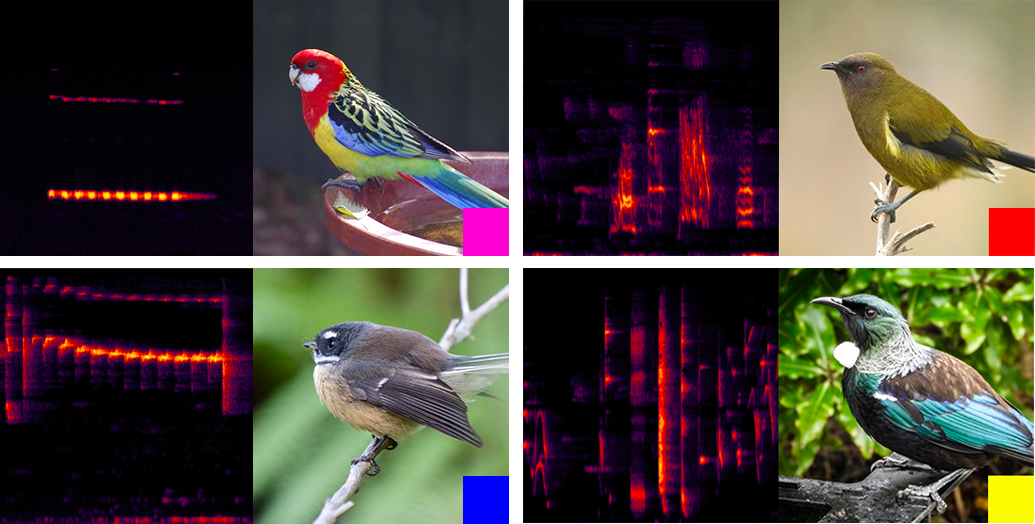
The spectrogram that emerges from this process tells a story. Each bird has its own signature, its unique pattern of frequencies and rhythms that can now be seen on our spectrogram. For example, the gentle cooing of a dove creates smooth, flowing patterns, while the rapid chirps of a sparrow might look like staccato bursts of color.
Applications in Ornithology and Beyond
For the Cornell Lab of Ornithology, these spectrograms are more than just pretty pictures. They are a key to unlocking the mysteries of avian communication. By analyzing these patterns, researchers can identify species, monitor bird populations, track migratory patterns, and even detect the influences of environmental changes on bird behaviors.
In a broader sense, the technology for spectrogram analysis has far-reaching applications; from medical diagnostics that analyze patterns in heartbeats, to enhancing musical technology that can isolate individual instruments in a symphony - the potential is as vast as the spectrum of sounds that surround us.
A Symphony of Pixels and Frequencies
As we continue to refine and develop our software, we move closer to not only understanding bird sounds but also appreciating the complex beauty of nature's music. Spectrograms bridge the gap between the auditory and visual, allowing us to see the unseen and hear the silent. They are a testament to the intricate tapestry of sound that weaves through the fabric of our natural world.